Friday, August 3, 2018

Enterprise Refills the Project Hopper in the Second Quarter

The first quarter of 2018 was a strangely quiet one for oil and gas midstream operator Enterprise Products Partners (NYSE:EPD). Typically, the company announces at least a couple of new projects each quarter to grow the business and fuel its distribution to shareholders. Apparently, it was saving most of its project announcements for this past quarter as management added $600 million to its capital expenditure guidance for the year.�

Let's take a look at Enterprise's most recent earnings results and some of the new projects that management found too compelling to turn down.�

Oi land gas storage tanks.

Image source: Getty Images.

Enterprise Products Partners' results: The raw numbers Metric Q2 2018 Q1 2018 Q2 2017
Gross operating margin $1.48 billion $1.59 billion $1.38 billion
Net income $687 million $912 million $666 million
Diluted EPS $0.31 $0.41 $0.30
Distributable cash flow $1.43 billion $1.39 billion $1.05 billion

DATA SOURCE: ENTERPRISE PRODUCTS PARTNERS EARNINGS RELEASE. EPS = EARNINGS PER SHARE.

For a company that has a reputation as a slow-growing business, Enterprise's growth over the past year or so has been off the charts, with its reported 36% year-over-year jump in distributable cash flow. That increase is a result of several new projects starting commercial operations this past quarter including its propane dehydrogenation (PDH) petrochemical plant, a natural gas processing facility in the Permian Basin, and a natural gas liquids fractionator facility. As these facilities ramp up to full capacity, we should expect even better results.

The one stain on its earnings report was a $322 million, or $0.15 per share, noncash loss related to some crude oil futures contracts. Those mark-to-market�losses, part of fair value accounting practices, are why its crude oil services segment posted a significant decline compared to the prior quarter. Absent those charges, all four of its business segments posted considerable gains.�

EPD gross operating margin by business segment for Q2 2017, Q2 2018, and Q2 2018. Shows sharp decline in crude oil and increases in every other segment.

Data source: Enterprise Products Partners earnings release. Chart by author.

What happened with Enterprise Products Partners this quarter? Total capital expenditures were $983 million for the quarter, which was down slightly compared to the first quarter. That is to be expected, though, as Enterprise brought $1.4 billion in projects into service in the first half of the year. However, management increased its capital spending guidance to�$3.8 billion to $4.0 billion for growth projects, up from�$3.2 to $3.4 billion in the third quarter. The increase in capital spending came after several new project announcements. The most recent string of investments have been heavily weighted toward processing and export facilities, but this past quarter management announced a slew of new projects to expand pipeline capacity for several of its existing projects. It announced a 100,000-barrel-per-day expansion of its Front Range and Texas Express pipelines to deliver growing natural gas liquid production from the Denver-Julesburg�shale basin in Colorado to its storage and petrochemical manufacturing hub in Mont Belvieu, Texas. It intends to reactivate a previously idle natural gas pipe that will deliver from the Barnett shale�formation to a supply hub in Sweeney, Texas. Also, it plans to develop an offshore crude oil export terminal that will be able to fuel Very Large Crude Carriers (VLCCs). Increased distributable cash flow resulted in a distribution coverage ratio of 1.5 times and produced�$491 million in excess cash, which Enterprise intends to use to fund a significant portion of this massive capital spending program over the next 18 months. What management had to say

As part of the company's press release statement, CEO Jim Teague highlighted a couple of the major capital projects recently brought into service and the impact of it had on the bottom line.�

Our PDH facility, which completed commissioning activities and began commercial service in the second quarter, operated at full capacity. The�Midland-to-ECHO crude oil pipeline averaged 545 thousand barrels per day of gross transportation volumes from the�Permian Basin. In total, our liquid pipeline volumes were a record 6.2 million barrels per day and our marine terminal volumes were a record 1.7 million barrels per day.

This operational performance generated record distributable cash flow, excluding proceeds from asset sales, of�$1.4 billion, which provided 1.5 times coverage of our distribution for the quarter. We retained�$491 million�of distributable cash flow to reinvest in the growth of the partnership, which supports our goal of self-funding the equity portion of our growth capital investment.

You can read a full transcript of Enterprise's conference call here.�

EPD Chart

EPD data by YCharts

Ready for the next round

Back at the end of last year, Enterprise's management announced that it was slowing down its distribution growth rate. The aim of the decision was to free up more excess cash to reinvest in the business and become less reliant on issuing equity as a source of funding. This past quarter shows why this was a good decision. The company now has a backlog of construction projects totaling $5.2 billion it expects to complete by the end of 2019. It goes to show the immense investment opportunities in U.S. energy infrastructure over the next several years. With all that retained cash, don't be surprised if we see even more projects get added to the mix over the next several months.

Thursday, August 2, 2018

Brokerages Anticipate Encompass Health Corp (EHC) to Announce $0.83 Earnings Per Share

Wall Street brokerages expect that Encompass Health Corp (NYSE:EHC) will post earnings of $0.83 per share for the current fiscal quarter, Zacks Investment Research reports. Six analysts have issued estimates for Encompass Health’s earnings. The lowest EPS estimate is $0.82 and the highest is $0.86. Encompass Health posted earnings of $0.71 per share in the same quarter last year, which indicates a positive year-over-year growth rate of 16.9%. The business is expected to announce its next quarterly earnings results after the market closes on Wednesday, July 25th.

On average, analysts expect that Encompass Health will report full year earnings of $3.39 per share for the current financial year, with EPS estimates ranging from $3.36 to $3.45. For the next year, analysts anticipate that the firm will post earnings of $3.65 per share, with EPS estimates ranging from $3.55 to $3.75. Zacks Investment Research’s earnings per share averages are an average based on a survey of sell-side analysts that cover Encompass Health.

Get Encompass Health alerts:

Encompass Health (NYSE:EHC) last released its quarterly earnings data on Thursday, April 26th. The company reported $0.93 earnings per share for the quarter, beating analysts’ consensus estimates of $0.81 by $0.12. Encompass Health had a net margin of 6.76% and a return on equity of 20.76%. The company had revenue of $1.05 billion during the quarter, compared to analysts’ expectations of $1.03 billion.

A number of research analysts have weighed in on the stock. Craig Hallum lifted their price objective on shares of Encompass Health from $63.00 to $71.00 and gave the company a “buy” rating in a report on Monday, April 30th. Royal Bank of Canada lifted their price objective on shares of Encompass Health to $69.00 and gave the company an “outperform” rating in a report on Monday, April 30th. ValuEngine raised shares of Encompass Health from a “buy” rating to a “strong-buy” rating in a report on Friday, April 27th. Robert W. Baird boosted their target price on shares of Encompass Health from $59.00 to $66.00 and gave the stock an “outperform” rating in a research note on Monday, April 30th. Finally, Credit Suisse Group boosted their target price on shares of Encompass Health from $65.00 to $66.00 and gave the stock an “outperform” rating in a research note on Friday, April 27th. Two equities research analysts have rated the stock with a hold rating, six have given a buy rating and one has given a strong buy rating to the company. Encompass Health presently has a consensus rating of “Buy” and an average price target of $67.33.

Encompass Health traded down $0.38, reaching $69.87, on Tuesday, according to MarketBeat. The stock had a trading volume of 419,691 shares, compared to its average volume of 1,190,642. Encompass Health has a 12-month low of $42.21 and a 12-month high of $70.43. The company has a debt-to-equity ratio of 1.77, a quick ratio of 1.24 and a current ratio of 1.24. The stock has a market capitalization of $6.90 billion, a price-to-earnings ratio of 23.29, a PEG ratio of 1.59 and a beta of 0.35.

The business also recently announced a quarterly dividend, which was paid on Monday, July 16th. Stockholders of record on Monday, July 2nd were paid a dividend of $0.25 per share. The ex-dividend date of this dividend was Friday, June 29th. This represents a $1.00 dividend on an annualized basis and a dividend yield of 1.43%. Encompass Health’s dividend payout ratio is currently 36.23%.

Encompass Health Company Profile

Encompass Health Corporation provides facility-based and home-based post-acute healthcare services in the United States. The company operates through two segments, Inpatient Rehabilitation, and Home Health and Hospice. The Inpatient Rehabilitation segment provides specialized rehabilitative treatment on an inpatient and outpatient basis to patients who are recovering from conditions, such as stroke and other neurological disorders, cardiac and pulmonary conditions, brain and spinal cord injuries, complex orthopedic conditions, and amputations.

Featured Article: What does RSI mean?

Get a free copy of the Zacks research report on Encompass Health (EHC)

For more information about research offerings from Zacks Investment Research, visit Zacks.com

Sunday, July 22, 2018

1World Trading Up 5.7% Over Last Week (1WO)

1World (CURRENCY:1WO) traded 6.7% higher against the U.S. dollar during the 1 day period ending at 22:00 PM E.T. on July 21st. One 1World token can now be purchased for approximately $0.17 or 0.00002329 BTC on major exchanges. During the last week, 1World has traded 5.7% higher against the U.S. dollar. 1World has a market capitalization of $3.60 million and approximately $71,973.00 worth of 1World was traded on exchanges in the last day.

Here’s how other cryptocurrencies have performed during the last day:

Get 1World alerts: XRP (XRP) traded up 2% against the dollar and now trades at $0.46 or 0.00006102 BTC. Stellar (XLM) traded up 11.8% against the dollar and now trades at $0.30 or 0.00004079 BTC. IOTA (MIOTA) traded 4.7% higher against the dollar and now trades at $1.01 or 0.00013563 BTC. Tether (USDT) traded 0.1% lower against the dollar and now trades at $1.00 or 0.00013396 BTC. TRON (TRX) traded 4.5% higher against the dollar and now trades at $0.0361 or 0.00000483 BTC. NEO (NEO) traded up 5.5% against the dollar and now trades at $34.55 or 0.00462920 BTC. Binance Coin (BNB) traded 2.4% higher against the dollar and now trades at $12.27 or 0.00164396 BTC. VeChain (VET) traded 8.1% higher against the dollar and now trades at $1.90 or 0.00025482 BTC. 0x (ZRX) traded 13% higher against the dollar and now trades at $1.18 or 0.00015843 BTC. Zilliqa (ZIL) traded up 5% against the dollar and now trades at $0.0740 or 0.00000992 BTC.

About 1World

1World’s genesis date was November 30th, 2017. 1World’s total supply is 37,219,453 tokens and its circulating supply is 20,686,551 tokens. The official website for 1World is ico.1worldonline.com. 1World’s official Twitter account is @1World_Online.

1World Token Trading

1World can be bought or sold on these cryptocurrency exchanges: Qryptos. It is usually not presently possible to buy alternative cryptocurrencies such as 1World directly using U.S. dollars. Investors seeking to acquire 1World should first buy Bitcoin or Ethereum using an exchange that deals in U.S. dollars such as Changelly, Coinbase or GDAX. Investors can then use their newly-acquired Bitcoin or Ethereum to buy 1World using one of the exchanges listed above.

Friday, July 20, 2018

A High-Octane Dividend Growth Stock You Won��t Want to Overlook

We measure investing wins and losses by how a stock performs against the broader market, with most benchmarking against the S&P 500. While many investors assume that high-octane growth stocks give them the best chance to earn market-beating returns, dividend growth stocks have trounced their nonpaying peers over the last several decades.

According to a study by Ned Davis Research, companies that increased their dividends on a consistent basis have delivered a total annual return of nearly 10.1% going all the way back to 1972. That has not only outpaced the S&P 500's 7.7% yearly total return over that time frame, but also the paltry 2.6% average annual gain of nonpayers.

Given that data, it would behoove investors to focus more on finding companies poised to grow their dividends at a healthy pace, since that would theoretically provide them with more fuel to outperform. That's why investors won't want to miss what oil driller EOG Resources (NYSE:EOG) has on tap. While its paltry 0.6%-yielding dividend might not appeal to income investors, its dividend growth prospects have the potential to continue fueling market-smashing returns.

Rising coin stocks in the dirt with plants growing on top.

Image source: Getty Images.

A jaw-dropping dividend growth history

EOG Resources has quietly been one of the better dividend growth stocks since it began paying one in early 1998. From that starting point, the oil giant has increased its payout at a remarkable 19% compound annual growth rate, boosting it a stunning 2,366% overall. That rapidly growing income stream has richly rewarded investors by fueling an equally impressive total return of 2,620% over that time frame, which has pulverized the 305% total return generated by the S&P 500.

However, like most oil stocks, EOG Resources lacked the fuel to grow its dividend during the industry's most recent downturn. Because of that, the company pressed the pause button on dividend growth in 2015. While that ended a 16-year streak of consecutive dividend increases, it could have been far worse.

Many of its peers slashed or eliminated their dividends to preserve cash. Former dividend stalwarts ConocoPhillips (NYSE:COP) and Anadarko Petroleum (NYSE:APC) were among the many that caved under the pressure of lower oil prices, with ConocoPhillips slicing its payout by two-thirds, while Anadarko slashed its�dividend by 82%.

Reset and ready to hit the accelerator

By preserving cash during the industry's dark days, and making changes to drive down costs, oil companies are in a position to begin returning more money to shareholders now that market conditions are on the upswing. ConocoPhillips has already increased its payout 14% in the last two years, while Anadarko jacked its�dividend up fivefold, putting it within striking distance of its former peak. EOG, meanwhile, restarted dividend growth this year by raising its payout 10.4%.

That increase is only the beginning for EOG Resources. The oil driller repositioned its business to thrive as long as oil remains above $50 a barrel. At that price point, the company can generate enough cash flow to fund its current dividend and invest in drilling the new wells needed to grow its U.S. oil production at a more than 15% compound annual growth rate. That oil-fueled growth would expand cash flow at an even greater pace. Meanwhile, with crude currently near $70 a barrel, EOG is in position to produce a significant windfall of excess cash going forward.

Because of that, EOG believes it can grow its dividend at an accelerated pace. In fact, it aims to increase the payout at a greater than 19% compound annual growth rate going forward, which is the pace it has kept up since 1999. That higher-octane dividend growth could provide EOG with the fuel it needs to continue delivering market-smashing returns.

This factor yields a higher return in the long run

Most dividend investors focus on stocks with higher yields because they want to generate more income now. As a result, they'll likely take one look at EOG Resources' paltry 0.6%-yielding payout and toss it aside. That approach, however, can cause them to miss out on an even bigger payday, which is what EOG has provided its investors over the years with its fast-paced dividend growth. That's why investors won't want to miss the fact that this oil giant is about to hit the accelerator on dividend growth, which could be its ticket to delivering continued outperformance.�

Thursday, July 19, 2018

Bitcoin prices sees biggest daily surge in three months, up more than 10%

Bitcoin prices surged more than 10% Tuesday, taking the No. 1 digital currency back above $7,000 for the first time in five weeks and on track to record its biggest daily gain since April 12. In doing so, bitcoin BTCUSD, +10.34% traded above its 50-day moving average, a closely watched momentum indicator. The rally for bitcoin has been aided by four consecutive winning days, which if gains hold also would represent its longest stretch since April. A single bitcoin last changed hands at $7,371.87, up 10.7% since Monday 5 p.m. on the Kraken crypto exchange. By comparison the Dow Jones Industrial Average DJIA, +0.36% has gained 0.3%, the S&P 500 SPX, +0.54% is up 0.5% and the Nasdaq Composite Index COMP, +0.74% is higher by 0.6%.

See Full Story Trump Today: President backtracks, now says he accepts Russia meddled in U.S. election

On the defensive after a European trip that drew criticism from fellow Republicans as well as Democrats, President Donald Trump on Tuesday tweeted out defenses to his actions.

Friday, July 13, 2018

Dividend Investors Learn To Love Small Fries And REITs

&l;p&g;Action in the bond market exerts a huge influence on stocks and other asset classes, and as rates move higher, there will one day be a point at which even stock market investors flee risky assets for the guarantee of a juicy double-digit yield. We&a;rsquo;re not there yet, but going back more than a generation to the summer of 1981, the yield on the 10-year U.S. Treasury note topped 16%, and bank certificates of deposit would earn you an annual percentage yield of 17% or higher. Those days are long gone, but if interest rates adhere to their typical 36-year cycle of rising and falling, we may have turned the corner last year, and rates will be heading higher for the next several decades. Those fat yields from the 1980s may be reappearing in the early 2050s.

&l;img class=&q;size-full wp-image-6858&q; src=&q;http://blogs-images.forbes.com/johndobosz/files/2018/07/fred.jpg?width=960&q; alt=&q;&q; data-height=&q;469&q; data-width=&q;1163&q;&g; Source: Federal Reserve Bank of St. Louis.

My area of expertise is equity income investing, and I maintain a Top 25 portfolio of dividend-paying stocks that&s;s posted every Friday evening in &l;a href=&q;https://protect-us.mimecast.com/s/2EWDC31YDLf2MyXjcDNlnT&q; target=&q;_blank&q;&g;&l;em&g;Forbes Dividend Investor&l;/em&g;&l;/a&g;. The investment thesis here is that if you buy companies temporarily out of favor but still able to pay steady or even rising dividends, you lock into a situation with great capital gains potential, and a generous dividend yield, often 4% or higher.

I select stocks for the Top 25 using criteria that include discounts to five-year average multiples of price to sales, book value, earnings, cash flow and enterprise value/Ebitda (earnings before interest, taxes, depreciation and amortization). Stocks are rewarded for superior rates of dividend growth and revenue growth, as well as for high yields and low payout ratios. Operating cash flow over the past 12 months needs to be positive and must be sufficient to cover the dividend.

I track weekly performance of the Forbes Dividend Investor Top 25 model portfolio against 20 dividend ETFs. The equally-weighted Top 25 has produced a 5.2% year-to-date return, higher than any of the ETFs, except for the WisdomTree SmallCap Dividend Fund (DES), up 6.3% YTD through July 9.

Bigger has not been better in dividend stocks so far in 2018, as small-capitalization stocks have trounced their larger-cap brethren in terms of performance, a gap that&a;rsquo;s widened since the market corrected in early February, and again over the past two months. Year-to-date, the Russell 2000 Small Cap Index (IWM) ETF has returned 11.7%, more than double the 5.0% return from the large-cap SPDR S&a;amp;P 500 Index (SPY).

Over the past five months since the market began to recover from the January-February correction, DES has jumped higher by more than 12%, and so has the iShares Cohen &a;amp; Steers REIT (ICF) ETF, a proxy for U.S.-listed real estate investment trusts.

&l;img class=&q;size-full wp-image-6859&q; src=&q;http://blogs-images.forbes.com/johndobosz/files/2018/07/etfs.jpg?width=960&q; alt=&q;&q; data-height=&q;466&q; data-width=&q;700&q;&g; from Stockcharts

The outperformance of small-caps is due at least in part to fears of a trade war, which have taken a toll on large multinational companies that are heavily dependent on exports. Smaller companies, by comparison, tend to do nearly all their business domestically.

Raging performance of REITs since early February is a result of deeply oversold levels for many REITs earlier this year as interest rates jumped higher. Except for a spike in May, long-term interest rates have declined over the past five months. Meanwhile, REITs have favorable fundamentals with a strong economy, low unemployment and surging retail sales.

It makes sense that the Top 25 has enjoyed outperformance versus most dividend ETFs, because small-caps and REITs enjoy strong representation. Eight of the 25 stocks (32%) are REITs, and the median market capitalization of the stocks in the portfolio is $4 billion. Sixteen (64%) have a market capitalization less than $7 billion.

Here are two small-caps, one of them a REIT, currently on the Top 25.

West Palm Beach, Florida-based &l;strong&g;Chatham Lodging Trust&l;/strong&g; (CLDT) is a real estate investment trust that owns interests in 135 upscale and premium-branded hotels, with 18,516 rooms. Revenue this year is expected to climb 5% to $314.8 million, and funds from operations have grown 16.9% per year over the past five years.

Chatham is a monthly dividend-payer, with the ex-dividend date for the next $0.11 per share payout coming up on July 30. In addition to the monthly dividend and discounted valuations relative to history, what&a;rsquo;s also encouraging about Chatham is a &l;u&g;&l;a href=&q;https://protect-us.mimecast.com/s/DTUYC1wVAJFqmP6riGk26n&q; target=&q;_blank&q;&g;rash of insider buying going back to February&l;/a&g;&l;/u&g; by top company brass, including the chief executive officer, chief operating officer and chief investment officer. With a market capitalization of $990 million, Chatham is both a REIT and a small-cap.

Another small-cap recently added to the Top 25 is &l;strong&g;Pitney Bowes&l;/strong&g; (PBI). Founded in 1920 as a seller of postage metering equipment, the Stamford, Connecticut-based company has been forced to diversify and transform its business as electronic communications have supplanted many written notices sent through the U.S. Mail from businesses to customers. Today Pitney Bowes provides information management, location intelligence and customer engagement products and solutions, as well as shipping, mailing, fulfillment, returns and cross-border e-commerce products and solutions that enable the sending of parcels and packages. Revenue and Ebitda began to turn higher in the fourth quarter of last year, and the stock trades near a five-year low, with valuations severely discounted from five-year averages.

&l;u&g;&l;a href=&q;https://protect-us.mimecast.com/s/SqpCC2kGBKs8GBVLiBOMhz&q; target=&q;_blank&q;&g;Insiders have been buying company stock.&l;/a&g;&l;/u&g; The CEO purchased $100,000 worth of shares on May 8 at $9.02 per share, and the chief financial officer, somebody who should know what&a;rsquo;s going on with the numbers, purchased $88,000 worth at $8.82 per share.

Pitney Bowes is a bit of a scoundrel, having cut its dividend in half five years ago, so it warrants extraordinary suspicion, but with top officers buying stock and the revenue picture getting brighter, buying at five-year lows might look smart in several months&a;rsquo; time.

&l;em&g;John Dobosz is the editor of &l;a href=&q;https://protect-us.mimecast.com/s/2EWDC31YDLf2MyXjcDNlnT&q; target=&q;_blank&q;&g;Forbes Dividend Investor &l;/a&g;and &l;a href=&q;https://protect-us.mimecast.com/s/6rRhC4xW0MflWDzZtV0WNQ&q; target=&q;_blank&q;&g;Forbes Premium Income Report&l;/a&g;.&l;/em&g;&l;/p&g;

Thursday, July 12, 2018

Crisis Alert: The $80,000 Job Nobody Wants Is Costing You Money!

It is a problem impacting everyone, including you.

And it is hitting us right where it hurts �� in the wallet.

The issue is a massive shortage of truck drivers in the United States. American Trucking Associations believe that we need at least 50,000 additional truck drivers, and we need them today.1

It isn’t hard to fathom how a shortage of truck drivers impacts all of us financially. Just take a look around you right now��

If something is in your home, then it has at some point been on a truck.

To attract new drivers companies have had to pay more. On top of that we also have rising fuel costs.

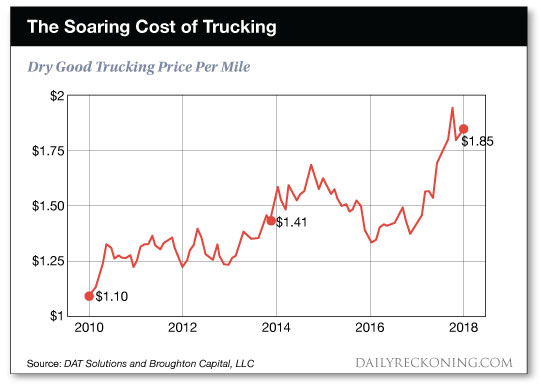
The cost of shipping a “dry good” (one that doesn’t require refrigeration or special conditions) by truck has risen by almost 80 percent since 2010 and 40 percent in the past year alone.

soaring cost of trucking

These increased trucking costs are impacting nearly every company that is in the business of selling goods.

Tyson Foods (TSN: NYSE) for example has indicated that its shipping costs will increase by a whopping $200 million this year. It doesn’t matter what is being shipped, if it is going by truck it will cost more.

You know what happens when corporations see their costs rise. They pass those cost increases on to us, the consumers. Since virtually everything we consume gets shipped to us, that means we are going to be paying more for everything.

Were you wondering why the cost of your Amazon Prime membership jumped from $99 to $119? This truck driver shortage is it.

Worse still, this is not going to be a temporary problem.

With e-commerce growing at a rapid pace, an even greater strain will be placed on our transportation system and the truck driver shortage will grow.

Expectations are that we will need nearly 900,000 new drivers over the next decade to keep up with the growth in demand for freight transportation.2 There is no way that the trucking industry attracts all of those bodies without continuing to offering higher and higher compensation��

We Can Eat These Cost Increases Or We Can Do Something About Them

It is pretty clear that as consumers, we are going to be bearing the brunt of these shipping cost increases over the coming decade.

It therefore makes sense for us as investors to hedge way our exposure to what is coming.

So how do we do that? How do we profit from truck driver wages rising?

Next to becoming truck drivers ourselves, the most obvious way to do that is by owning the railroads which become much more competitive as the cost of trucking goes up.

Interestingly, we wouldn’t be the first smart investors to see opportunity in the railroads. Warren Buffett purchased all of Burlington Northern Santa Fe in 2009 for his company Berkshire Hathaway, and his pal Bill Gates has owned a significant position in the Canadian National Railway since 2002.3

The specific railway that I like best right now is Kansas City Southern (KSU: NYSE). My preference for Kansas City Southern today is based entirely on one thing, the shares of the company are cheap.

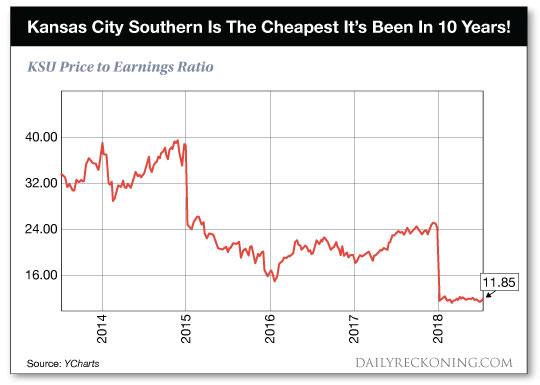
At just over 11 times earnings, KSU is trading at a lower multiple than it has for years.

Kansas City Southern

The reason for Kansas City Southern’s depressed valuation is concern over the North American Free Trade Agreement (NAFTA). KSU has built an expansive rail network that connects the U.S. heartland to Mexico, and President Trump’s threats to exit from the existing NAFTA deal have cast a shadow over KSU’s share price.

I believe that any concerns over the U.S. exiting NAFTA are more than priced into this stock.� The market has accepted the idea that NAFTA and trade in North America are going to crumble.

In doing so, the market has missed how much Kansas City Southern is going to benefit from a boom in the petrochemical business that is happening on the Gulf Coast. The market has also missed this company has just completed spending on two major capex projects and is going to see a $100 million reduction in spending this year. That means increased free cash flows which means more money for dividends and share repurchases.

Today, shares of Kansas City Southern are priced for the complete death of NAFTA. As they old saying goes, “if it’s in the news, it’s in the stock.”

I think there is significant upside here even if NAFTA disintegrates because of the items the market has missed. Should we get a resolution to this NAFTA issue that is any less than disastrous for trade with Mexico, this stock will move higher in a hurry.

That means that these shares don’t have much room to fall, but oodles of room to rise. That is especially true with the demand for railroad shipments increasing as the cost of shipping by truck rises.

This is the kind of risk/reward trade that we should always be looking for.

Here’s to looking through the windshield,

Jody Chudley

Jody Chudley
Financial Analyst, The Daily Edge
EdgeFeedback@AgoraFinancial.com

1America has a massive truck driver shortage. Here’s why few want an $80,000 job., WaPo
2There Aren’t Enough Truckers, and That’s Pinching U.S. Profits, Bloomberg
3BILL & MELINDA GATES FOUNDATION TRUST, Whale Wisdom

Monday, July 9, 2018

Gold tries for best levels in 2 weeks after the dollar��s recent retreat

Gold futures prices climbed Monday, with the recent retreat in the U.S. dollar helping to put the metal on track to notch its strongest level in roughly two weeks, as investors tested key chart territory for bruised bullion.

August gold GCQ8, +0.32% was up $5.90, or 0.5%, at $1,261.70 an ounce. A settlement around this level would be the highest since June 25, FactSet data show.

��All will depend on the U.S. dollar for gold,�� said Chintan Karnani, chief market analyst at Insignia Consultants. And ��more negative news from the U.S. trade war should be bullish for gold.��

The North Atlantic Treaty Organization meeting coming up this week may ��also affect the U.S. dollar and gold,�� said Karnani. ��Trump and his bag of surprises in the NATO meet will keep financial markets nervous.��

Gold notched a slight gain for last week, after a mostly upbeat U.S. jobs report was seen keeping the Federal Reserve on a path toward gradually higher interest rates, moving at no faster a pace than longtrend expectations for markets. Yet, gold futures at the start of last week had hit their lowest levels of 2018, knocked lower by a strengthening dollar.

Gold��s $1,260 line ��needs to be broken to generate momentum in a recovery,�� said Richard Perry, analyst at Hantec Markets, in a note ahead of Monday��s action. ��It would imply a move towards $1,282��and further out, there is plenty of resistance between $1,282/$1,300.��

The most popular fund tracking gold, the SPDR Gold Shares GLD, +0.34% was up about 0.5%.

The ICE U.S. Dollar Index DXY, +0.13% traded nearly flat Monday, but was down 0.6% so far this month. A weaker buck can make assets pegged to the currency, including gold, more attractive to buyers using other monetary units.

In fact, gold, often used as a haven asset, firmed even as U.S. stocks saw a strong start to the week. Global markets eased their focus on trade matters for now. Concerns about fraying relationships between the U.S. and its longstanding trade partners in the European Union, North American and China, have helped strengthen the dollar and have weighed on commodities priced in the monetary unit, including bullion. The dollar index has posted gains in each of the last three months, while gold futures fell in April, May and June.

Gold demand also has been hurt by the fear that a trade spat may hurt Beijing��s economy, which already has shown signs of decelerating in recent months. China is one of the world��s biggest buyers in metals, including gold.

Check out: MarketWatch��s Economic Calendar

Around the metals complex, September silver SIU8, +0.47% rose 0.5% to $16.155 an ounce. Silver shed about 0.8% for last week. The most popular exchange-traded fund that tracks silver, the iShares Silver Trust SLV, +0.53% �was up 0.6% for last week and already rebounding about 1% early Monday.

October platinum PLV8, +0.51% �rebounded 1.5% to $861.60 an ounce. It logged a weekly loss of 1.1% through Friday after settling Monday at the lowest for a most-active contract since late 2008.

Read: How platinum is starting to shine for bargain hunters

September copper HGU8, +1.19% �rose 1.2% at $2.857 a pound. while September palladium PAU8, +0.52% �added 0.8% to $955.40 an ounce.

We Want to Hear from You

Join the conversation

Comment Related Topics Metals and Minerals Metal Exchange U.S. Stocks Markets Gold Silver Copper Quote References GCQ8 +4.00 +0.32% GLD +0.40 +0.34% DXY +0.12 +0.13% SIU8 +0.08 +0.47% SLV +0.08 +0.53% PLV8 +4.30 +0.51% HGU8 +0.03 +1.19% PAU8 +4.90 +0.52% Show all references MarketWatch Partner Center Most Popular Changes afoot for HBO under AT&T��s new reign

Saturday, July 7, 2018

Instagram Has Become Facebook's Best Investment -- By Far

In April 2012,�Facebook (NASDAQ:FB)�rocked the tech world when it announced it had paid $1 billion for Instagram. The purchase sent heads shaking and tongues wagging. Even late night TV got into the game as�Jon Stewart, then host of The Daily Show, famously quipped, "A billion dollars of ... money? For a thing that kind of ruins your pictures?"�

Now, just six years later, it looks like Facebook CEO Mark Zuckerberg gets the last laugh. In an analysis conducted by Bloomberg Intelligence, analyst Jitendra Waral estimates that Instagram would be worth a whopping $100 billion, assuming it was still a stand-alone company.�

A fashionably dressed woman takes a selfie in front of a vivid pink wall.

Image source: Getty Images.

Just six years ago...

At the time of the purchase, Instagram reportedly had 30 million iPhone-user accounts and an estimated 1 million new Android users when the app for that operating system was released. The company had no revenue and no business model to speak of. Facebook, meanwhile, was preparing for its IPO the following month and its users were uploading 250 million photos per day, illustrating the growing importance of photo sharing.�

Plenty of things have changed since then. Instagram recently announced that it had surpassed�1 billion monthly active users (MAUs) -- compare that to Facebook's 2.2 billion.�While Facebook's user growth is slowing, Instagram's growth will probably continue to accelerate�and it is expected to account for 28% of its parent company's mobile ad revenue for 2018. "With its rapidly increasing advertiser base, [Instagram] will quickly become the engine that drives growth for the whole," according to market research company eMarketer, which estimates that Instagram will account for as much as 40% of Facebook's revenue by 2020.�

The evolution continues

Waral believes that Instagram will eclipse 2 billion MAUs over the next five years and that it could potentially surpass Facebook's number of active users, pointing to Instagram's faster adoption curve.

The entry into video is likely to be a main growth driver, and it began in earnest when Instagram Stories debuted in August 2016, which allowed users to share multiple short videos within a 24-hour time frame. The move, based on a similar feature in Snapchat, was followed by a rapid increase in both users and engagement levels. Instagram recently announced that its Stories feature surpassed 400 million daily active users, more than two times bigger than Snap's offering. The photo-sharing network is now pushing further into the video segment, with the recent launch of IGTV, a new feature that will allow creators to upload videos that are up to an hour long, far exceeding the previous limit of one minute.

This move is seen as a direct challenge to Google's YouTube, a division of Alphabet. While there are no plans to advertise on IGTV to start out, Instagram CEO Kevin Systrom said it's "obviously a very reasonable place [for them] to end up." He continued by saying there would also eventually be a revenue-sharing deal with creators.�

Screen shots of the Instagram app, one with three people smiling sitting on a fence, and another of fluffy clouds in a blue sky.

Image source: Instagram.

The opportunity will likely get bigger from here

While Facebook's acquisition of Instagram was widely questioned at the time, it seems rather prescient now. Digital video ad spending in the U.S. is expected to grow 25% in 2018 to nearly $7.9 billion, according to eMarketer via the New York Times. For its part, Instagram is expected to produce nearly $5.5 billion in ad sales this year, up more than 70% over 2017.

Those who have feared slowing growth at Facebook's flagship social network need to look no further than Instagram to see where the next generation of the company's growth will come from.

Friday, July 6, 2018

Sothebys (BID) Shares Bought by Millennium Management LLC

Millennium Management LLC increased its position in Sothebys (NYSE:BID) by 44.1% in the 1st quarter, according to the company in its most recent Form 13F filing with the Securities & Exchange Commission. The firm owned 308,524 shares of the specialty retailer’s stock after buying an additional 94,406 shares during the quarter. Millennium Management LLC owned about 0.60% of Sothebys worth $15,830,000 at the end of the most recent reporting period.

Several other institutional investors have also recently made changes to their positions in BID. Bank of New York Mellon Corp lifted its holdings in shares of Sothebys by 103.7% in the fourth quarter. Bank of New York Mellon Corp now owns 950,945 shares of the specialty retailer’s stock valued at $49,069,000 after buying an additional 484,141 shares during the period. Clal Insurance Enterprises Holdings Ltd lifted its holdings in shares of Sothebys by 21.9% in the first quarter. Clal Insurance Enterprises Holdings Ltd now owns 1,950,000 shares of the specialty retailer’s stock valued at $100,054,000 after buying an additional 350,000 shares during the period. Amundi Pioneer Asset Management Inc. acquired a new stake in shares of Sothebys in the first quarter valued at $14,182,000. BlackRock Inc. lifted its holdings in shares of Sothebys by 6.7% in the first quarter. BlackRock Inc. now owns 4,185,419 shares of the specialty retailer’s stock valued at $214,752,000 after buying an additional 263,550 shares during the period. Finally, Matarin Capital Management LLC acquired a new stake in shares of Sothebys in the first quarter valued at $12,657,000. Institutional investors and hedge funds own 90.91% of the company’s stock.

Get Sothebys alerts:

Several analysts have recently weighed in on the company. ValuEngine upgraded Sothebys from a “hold” rating to a “buy” rating in a report on Monday. Sidoti lowered Sothebys from a “buy” rating to a “neutral” rating in a report on Tuesday, June 12th. Zacks Investment Research upgraded Sothebys from a “hold” rating to a “buy” rating and set a $65.00 price objective for the company in a report on Friday, May 18th. TheStreet upgraded Sothebys from a “c+” rating to a “b-” rating in a report on Monday, March 19th. Finally, Cowen upped their target price on Sothebys from $63.00 to $65.00 and gave the company a “buy” rating in a report on Wednesday, March 28th. One analyst has rated the stock with a sell rating, one has assigned a hold rating and five have assigned a buy rating to the company’s stock. Sothebys presently has a consensus rating of “Buy” and a consensus price target of $63.00.

Shares of Sothebys opened at $55.34 on Thursday, according to Marketbeat. Sothebys has a 12 month low of $42.78 and a 12 month high of $60.16. The firm has a market cap of $2.87 billion, a PE ratio of 21.79 and a beta of 1.81. The company has a debt-to-equity ratio of 1.21, a current ratio of 1.25 and a quick ratio of 1.19.

Sothebys (NYSE:BID) last announced its earnings results on Thursday, May 3rd. The specialty retailer reported $0.09 EPS for the quarter, beating the consensus estimate of ($0.21) by $0.30. Sothebys had a return on equity of 24.21% and a net margin of 12.39%. The business had revenue of $195.80 million during the quarter, compared to the consensus estimate of $141.00 million. During the same period in the prior year, the business posted ($0.12) earnings per share. Sothebys’s revenue was down 1.8% compared to the same quarter last year. research analysts anticipate that Sothebys will post 2.81 earnings per share for the current fiscal year.

About Sothebys

Sotheby's operates as an auctioneer of authenticated fine art, decorative art, jewelry, wine, and collectibles in the United States, the United Kingdom, Hong Kong, China, Switzerland, France, and internationally. The company operates in two segments, Agency and Finance. The Agency segment accepts property on consignment; and matches sellers to buyers through the auction or private sale process.

Want to see what other hedge funds are holding BID? Visit HoldingsChannel.com to get the latest 13F filings and insider trades for Sothebys (NYSE:BID).

Institutional Ownership by Quarter for Sothebys (NYSE:BID)

Monday, June 25, 2018

PBOC Reserve Cut Not Aimed at Helping Housing Market, BOC Says

LISTEN TO ARTICLE 1:13 SHARE THIS ARTICLE Facebook Twitter LinkedIn Email

When China allowed banks to use 700 billion yuan ($108 billion) more of their deposits on Sunday, they were very clear on where the money should go.

One sector not mentioned was the overheating property market.

Money freed up from previous cuts may have ended up flowing into the housing market, and the design of this new policy seems aimed at preventing that, said Fan Ruoying, a researcher at the Bank of China’s International Institute of Finance in Beijing.

Loans to property developers and household rose 20.3 percent in the first quarter compared with a year ago, and the pace was faster than the overall loan expansion, Fan wrote in a note.

Previous Cuts May Have Flowed to Housing

Prices of newly built residential buildings

Source: Bloomberg Intelligence

.chart-js { display: none; }

The PBOC aims for 500 billion yuan to be channeled to debt-to-equity swaps, and 200 billion yuan to be freed up for smaller banks to lend to small firms. When they announced the cut on Sunday, the central bank also released detailed instructions to make sure that the money flows to where they want it to.

Funds released from the cut will be closely monitored, with every debt-to-equity transaction documented and submitted for review on a quarterly basis. The record of small businesses financing will also be included in the central bank’s macro-prudential assessment review, according to the statement.

— With assistance by Miao Han

Sunday, June 24, 2018

Banks May Be Using Lehman-Style Trick to Disguise Debt

LISTEN TO ARTICLE 2:35 SHARE THIS ARTICLE Facebook Twitter LinkedIn Email

Banks may be disguising their borrowings in a way similar to that used by Lehman Brothers Holdings Inc., with debt ratios falling within limits imposed by regulators just four times a year.

Lenders use repurchase agreements -- known as repos -- to massage down their assets as reporting dates approach, typically as quarters end, the Bank for International Settlements said in its Annual Economic Report. The practice boosts leverage ratios -- the ratio between capital and so-called leverage exposures -- allowing banks to report them as being in line with regulatory requirements, it said.

“The data indicate that window-dressing in repo markets is material,” BIS analysts said in the report. “Data from U.S. money market mutual funds point to pronounced cyclical patterns in banks’ U.S. dollar repo borrowing, especially for jurisdictions with leverage ratio reporting based on quarter-end figures.”

The practice “reduces the prudential usefulness of the leverage ratio, which may end up being met only four times a year,” said the Basel, Switzerland-based BIS, which is known as the central bank for central banks.

Lehman used repos to disguise its borrowings before it imploded in 2008 in the biggest-ever U.S. bankruptcy. The collapse prompted regulators to close an accounting loophole the firm had wriggled through to mask its debts and to introduce a leverage ratio globally. The Basel Committee on Banking Supervision recommends a minimum 3 percent ratio is used.

Repo Game

As well as negative effects on financial stability, using repos to game the requirement hinders access to the market for those who need it and obstructs monetary policy implementation, the BIS said.

In a repo, banks borrow short term against some of their assets with a promise to repurchase the collateral. The cash raised can then be lent out in a reverse repo and the collateral obtained used to back further borrowing. Closing the reverse repo at quarter-end raises cash that can be used to unwind the repo, shrinking the balance sheet and reducing leverage.

Banks’ ability to engage in this kind of window-dressing depends on the jurisdiction they are in, the BIS said. That’s because while countries including the U.S. and U.K. require lenders to report their leverage ratios based on daily averages over the period, others including France, Germany and Switzerland use end-period reporting.

Since early 2015, when banks began reporting leverage ratios, the size of the swings in the volume of repo transactions carried out by euro-area banks has been rising, according to the BIS. Contractions in the repo market have soared to more than $145 billion at the end of last year from about $35 billion over the period, the BIS said.

Tuesday, June 19, 2018

Emerging Stocks Reenter Zone of Underperformance

LISTEN TO ARTICLE 1:48 SHARE THIS ARTICLE Facebook Twitter LinkedIn Email

The euro-area debt crisis, the so-called taper tantrum in 2013 and the oil-price meltdown of 2014 all have one thing in common. They tethered the MSCI Emerging Markets Index below the 1,100 mark.

An $8 trillion rally since 2016 helped the equity benchmark for 24 major developing nations break away from that pattern. But the gauge fell back into it on Tuesday, and now a bear market is just a bad week away.

#lazy-img-328682592:before{padding-top:56.25%;}

As Donald Trump’s trade war undermines risk appetite and spurs a flight of capital from emerging markets, stocks are taking the worst hit, belying expectations earlier this year that the slump would be largely confined to bonds. Tuesday’s drop below 1,100 suggests that the asset class -- which remained resilient in the wake of the Federal Reserve’s interest-rate hikes, numerous political crises and oil-price fluctuations -- is succumbing to concern that a tit-for-tat tariff showdown will crimp global economic growth.

#lazy-img-328682446:before{padding-top:56.25%;}

The index is showing other signs of strain. Losses in the past five days have taken it decisively below the 23.6 percent Fibonaccci Retracement level, setting it on course to drop another 3 percent to 1,052. If that support is breached, emerging-market stocks may enter a bear market at about 1,018, fall below the 1,000 mark and head all the way to 982.

That would hand investors a total loss of 23 percent from January, when the index was at a 10-year high.

#lazy-img-328682856:before{padding-top:56.25%;}

Bearish technical signals also appear at the end of a slump, thereby acting as a precursor to a rebound. A return above 1,100 will take the MSCI index back into a downward channel it has been trading in since January, indicating short-term gains within that band. A breach of its upper bound might suggest the second leg of the stalled rally may be round the corner.

Monday, June 18, 2018

Top 10 money making ideas by experts which could give 4-12% returns in 30 days

A roller coaster ride for Nifty50, but strong buying at lower levels helped Nifty50 climb 10,800 on weekly basis. The index bounced back after hitting a low of 10,709.05 on June 8 to close at 10,817.70, a gain of nearly 0.5 percent on weekly basis.

Volatility rose after the US Federal Reserve hiked interest rates by 25 bps and ECB signalling an end to the bond purchases by 2018 end while BoJ maintained its ultra-loose monetary policy.

��Rising interest rates in the US and expected increase in interest rates from 2019 summer may weigh on the foreign portfolio investors (FPIs) flows going forward. Going ahead the markets would also weigh the concerns coming from possible trade war between US and China,�� Teena Virmani, Vice President �� Research at Kotak Securities Ltd told Moneycontrol.

��Higher interest rates have resulted in valuation multiple contractions and going forward gains in the market would largely hinge on earnings recovery,�� she said.

related news Buy Nava Bharat Ventures, target Rs 163: Dinesh Rohira Remain long on Nifty till 10,700 sustains; 3 buys that may return up to 17% Market Live: Sensex, Nifty flat amid US-China trade tensions; Brent crude below $73/bbl

On the technical front, most experts are of the view that a possibility of breakout beyond 10,800 is on the cards and could possibly extend towards 10920-10,930 levels gradually. On the flipside, 10,698 followed by 10,650 would be seen as immediate supports.

��We expect some consolidation in benchmarks with a positive bias. Traders are advised to focus on individual pockets that are poised for decent moves. This optimism remains valid as long as index maintains its position above the 10550 mark,�� Sameet Chavan, Chief Analyst, Technicals, and Derivatives at Angel Broking told Moneycontrol.

��As far as sector-specific view goes, we have been quite vocal since the last couple of weeks about ��Pharmaceutical�� space getting bottomed out. Friday��s gigantic move in this basket certainly validates our contradictory stance,�� he said.

Stock specific moves likely to happen in selective IT, Pharma, NBFC stocks and heavyweights stocks are likely to take lead while PSU, Auto, Cement, Mid and Small Cap stocks would be under pressure with limited upside.

��Stock wise we see the positive formation in Bajaj Finance, Bharat finance, Tata Elxsi, TCS, Infosys, HCL Tech, Torrent Pharma, Sun Pharma, Lupin, Jubilant Foodworks, UPL, etc,�� Chandan Taparia, Derivatives, and Technical Analyst at Motilal Oswal Securities told Moneycontrol.

Here is a list of top 10 money making ideas from different experts which could give 4-12% return in the next 30 days:

Analyst: Sameet Chavan, Chief Analyst, Technicals, and Derivatives at Angel Broking

Kaveri Seed Company Ltd: Buy| LTP: Rs 560.05| Target: Rs 625| Stop loss: Rs 524| Return 11%

Last week, after a long consolidation, the stock finally managed to burst through its recent congestion zone. If we look at the volume activity, it has picked up substantially during this development, providing credence to the breakout.

Since the last couple of days, we are seeing some subdued movement due to lack of follow up buying in the counter. But, if we consider the broader picture now, we would construe this as a good buying opportunity for a target of Rs 625. Traders can keep their stop losses at Rs 524.

Delta Corp Ltd: Buy | LTP: Rs 245.90 | Target: Rs 270 | Stop Loss Rs 229 | Return 10%

Last few months have not been great for this traders�� favorite counter after enjoying a relentless bull run throughout the calendar year 2017. Recently, stock prices consolidated within the boundaries of a ��Falling Wedge�� pattern.

Last week, we witnessed a breakout from this pattern with reasonably higher volumes. Although it would be too early for this call, we expect the stock to start the upward leg of the rally. Hence, one can look to go long for a target of Rs 270 by following a strict stop loss of Rs 229.

Analyst: Dinesh Rohira, Founder & CEO, 5nance.com

Nava Bharat Ventures Ltd: Buy | Target: Rs 163 | Stop-loss: Rs 132 | Return: 12%

Nava Bharat traded in a positive trajectory on its weekly price chart post its correction from its 52-week high of Rs 184 levels. It took a strong support at Rs 120 levels.

Despite a muted market breath, the scrip witnessed a strong momentum as it managed to break out from its multi-long moving average level of 200-50-days.

It also witnessed a substantial volume breakout on the weekly chart which indicates an upward trend. On the weekly price chart, the scrip registered a solid bullish candlestick pattern indicating a sustained rally post current breakout from crucial levels.

Further, the weekly RSI is placed at 58 which suggests a buying regime at a current level along with positive cues from MACD suggesting an upward shift.

The stock is likely to face resistance around Rs 168 while support level is placed at Rs 288. We have a buy recommendation for Nava Bharat Ventures which is currently trading at Rs 145.60

Hindustan National Glass & Industries Ltd: Buy | Target: Rs 113 | Stop-loss: Rs 95 | Return: 8%

After witnessing a sharp correction from Rs 167 odd levels in the past few months, Hind Nat Glass witnessed a reversal trend in the recent period. A strong support is placed at 78-76 levels.

The scrip registered a strong pullback throughout the session as it managed to decisively break out from its crucial moving average level of Rs 94 levels on closing basis coupled with positive volume growth above average.

The scrip gained about 12 percent on an intraday basis and about 32 percent on the weekly basis. The positive breakout on the weekly basis aided the scrip to form a long-solid bullish candlestick pattern indicating a strong reversal trend for a couple of sessions.

The weekly RSI trend registered an upward momentum at Rs 67 suggesting a buying regime along with MACD moving near bullish crossover.

The scrip has a support placed at Rs 78 levels and resistance level at Rs 128. We have a buy recommendation for Hindustan Nat Glass which is currently trading at Rs 104.90

Gruh Finance Ltd: Sell Target: Rs 309 | Stop-loss: Rs 335 | Return 4%

Gruh Finance witnessed a sharp correction on the weekly price chart despite making a decent move on the upside. The scrip came under pressure last week as it lost about 11 percent on weekly basis and slipped below the short-term moving average level of Rs 330.

It also witnessed a negative volume support indicating a sustained pressure on short-term basis.

The scrip formed a solid bearish candlestick pattern on its weekly price chart after breaching below important level indicating a sustained pressure.

Further, the secondary momentum trend continued to indicate negative signal with RSI slipping below at 39 coupled with the bearish outlook from MACD trend.

The scrip is facing a resistance at Rs 337 levels and crucial support from 100-days EMA is placed at Rs 305 levels. We have a SELL recommendation for Infibeam which is currently trading at Rs. 322.45.

Analyst: Rajesh Palviya �� Head-Technical & Derivatives, Axis Securities

CDSL: Buy| CMP: Rs 294| Target: Rs 308-320 | Stop loss: Rs 278 | Return 8.8%

With current week's 5 percent gains the stock has decisively broken out its five weeks consolidation range (290-265) on closing basis indicating a shift of short-term trend to upward. This breakout is accompanied with high volumes indicating increased participation on the rally.

The stock has also broken out past six months downward sloping "Trendline" breakout at 283 levels which reconfirms bullish sentiments in near term. Currently, the stock is well placed above its 20 and 50 days SMA which signals positive bias ahead.

The strength indicator - RSI is placed above its reference line on the daily and weekly chart which interprets rising strength on the rally.

Buying Range: Rs 294-290

Apollo Hospital Ltd: Buy | CMP: Rs 1,038 | Target: Rs 1064-1082 | Stop loss: Rs 980| Return 8.8%

On the daily chart, the stock has observed an "Inverse Head & Shoulder" - a short-term trend reversal pattern breakout at Rs 1,025 level on a closing basis. This breakout is supported with huge volumes indicating strength ahead.

The stock is sustaining above its 20 and 50-day SMA which supports bullish sentiments ahead. On the weekly chart, the stock has observed rising volumes which signal increased participation for short to medium term.

Daily as well as weekly indicators - RSI and Stochastic both are in positive territory which supports buying momentum to continue ahead.

Buying Range: Rs 1,030-1,010

Analyst: Mazhar Mohammad, Chief Strategist �� Technical Research & Trading Advisory, Chartviewindia.in

RIL: Buy | LTP: 1,013 | Target: Rs 1,130 | Stop loss: Rs 980 | Return 11%

With new lifetime highs, this counter appears to be heading for a fresh breakout above its multi-week ascending channel which has a potential target of Rs 1,130. Hence, positional traders are advised to buy into this counter now and on declines up to Rs 990 for a target of Rs 1,130 with a stop below Rs 1,180 on a closing basis.

Disclaimer: Reliance Industries Ltd. is the sole beneficiary of Independent Media Trust which controls Network18 Media & Investments Ltd.

Muthoot Finance: Buy | LTP: Rs 386.40 | Target: Rs 420 | Stop loss: Rs 380 | Return 8.8%

At a recent low of Rs 383, this counter retraced around 62 percent of its last leg of the rally from the lows of Rs 369 �� 399.

We suspect some sort of accumulation in this counter as for the most part of the Friday��s session it has remained in positive terrain withering the market turmoil.

If it has bottomed out and fresh upswing is in progress then the initial hurdle around Rs 405 should be taken off.

In such a scenario, it should head all the way to test 200-day moving average (DMA) whose value is placed around Rs 420. A stop suggested for the trade is a close below Rs 380.

Mahindra Lifespace: Buy | LTP: Rs 570.40 | Target: Rs 620 | Stop loss: Rs 540 | Return 8%

The recent price action in this counter with the expansion of intraday price range on high volumes is pointing towards some sort of accumulation suggesting it can be in for a sustainable up move going forward.

Hence, positional traders should buy now and on declines between Rs 560 �� 555 range for a target of Rs 620. A stop suggested for the trade is below Rs 540 on a closing basis.

Disclaimer: The views and investment tips expressed by investment experts on moneycontrol.com are their own and not that of the website or its management. Moneycontrol.com advises users to check with certified experts before taking any investment decisions. First Published on Jun 18, 2018 08:29 am

Wednesday, May 30, 2018

Cisco Systems, Inc. (CSCO) Position Cut by Mosaic Family Wealth LLC

Mosaic Family Wealth LLC reduced its holdings in shares of Cisco Systems, Inc. (NASDAQ:CSCO) by 56.8% during the 4th quarter, according to its most recent filing with the Securities and Exchange Commission (SEC). The institutional investor owned 13,846 shares of the network equipment provider’s stock after selling 18,196 shares during the period. Mosaic Family Wealth LLC’s holdings in Cisco Systems were worth $531,000 as of its most recent filing with the Securities and Exchange Commission (SEC).

Other large investors have also made changes to their positions in the company. Stonehearth Capital Management LLC acquired a new position in Cisco Systems during the 4th quarter valued at about $102,000. Keeler Thomas Management LLC acquired a new position in shares of Cisco Systems in the fourth quarter valued at about $108,000. Goodman Financial Corp acquired a new position in shares of Cisco Systems in the fourth quarter valued at about $115,000. Tarbox Family Office Inc. increased its holdings in shares of Cisco Systems by 67.9% in the fourth quarter. Tarbox Family Office Inc. now owns 3,328 shares of the network equipment provider’s stock valued at $127,000 after purchasing an additional 1,346 shares during the period. Finally, Delphi Private Advisors LLC increased its holdings in shares of Cisco Systems by 307.8% in the fourth quarter. Delphi Private Advisors LLC now owns 3,552 shares of the network equipment provider’s stock valued at $136,000 after purchasing an additional 2,681 shares during the period. 73.89% of the stock is currently owned by institutional investors.

Get Cisco Systems alerts:

In other news, EVP David Goeckeler sold 20,671 shares of Cisco Systems stock in a transaction on Thursday, March 15th. The stock was sold at an average price of $45.50, for a total value of $940,530.50. The sale was disclosed in a legal filing with the Securities & Exchange Commission, which can be accessed through this hyperlink. Insiders own 0.05% of the company’s stock.

CSCO stock opened at $43.26 on Tuesday. The company has a quick ratio of 2.28, a current ratio of 2.34 and a debt-to-equity ratio of 0.44. The firm has a market cap of $208.41 billion, a price-to-earnings ratio of 20.12, a price-to-earnings-growth ratio of 3.09 and a beta of 1.14. Cisco Systems, Inc. has a 52-week low of $30.36 and a 52-week high of $46.37.

Cisco Systems (NASDAQ:CSCO) last issued its quarterly earnings data on Wednesday, May 16th. The network equipment provider reported $0.66 earnings per share for the quarter, beating the Zacks’ consensus estimate of $0.65 by $0.01. Cisco Systems had a positive return on equity of 19.48% and a negative net margin of 2.61%. The business had revenue of $12.46 billion during the quarter, compared to analysts’ expectations of $12.42 billion. During the same period in the previous year, the firm posted $0.60 earnings per share. equities research analysts anticipate that Cisco Systems, Inc. will post 2.34 earnings per share for the current fiscal year.

Cisco Systems announced that its Board of Directors has authorized a share buyback plan on Wednesday, February 14th that permits the company to repurchase $25.00 billion in shares. This repurchase authorization permits the network equipment provider to purchase shares of its stock through open market purchases. Shares repurchase plans are usually a sign that the company’s management believes its stock is undervalued.

CSCO has been the topic of a number of recent research reports. Piper Jaffray Companies set a $48.00 target price on Cisco Systems and gave the stock a “buy” rating in a research note on Thursday, February 15th. Citigroup upped their target price on Cisco Systems from $40.00 to $46.00 and gave the stock a “buy” rating in a research note on Tuesday, February 13th. Instinet upped their target price on Cisco Systems from $39.53 to $46.00 and gave the stock a “buy” rating in a research note on Monday, February 12th. Nomura upgraded Cisco Systems from a “neutral” rating to a “buy” rating and set a $33.00 target price on the stock in a research note on Monday, February 12th. Finally, Royal Bank of Canada restated a “buy” rating and issued a $44.00 target price on shares of Cisco Systems in a research note on Monday, February 12th. Eleven research analysts have rated the stock with a hold rating, twenty-four have issued a buy rating and one has given a strong buy rating to the company’s stock. Cisco Systems has a consensus rating of “Buy” and a consensus target price of $46.11.

About Cisco Systems

Cisco Systems, Inc designs, manufactures, and sells Internet Protocol (IP) based networking and other products related to the communications and information technology industry worldwide. The company offers switching products, including fixed-configuration and modular switches, and storage products that provide connectivity to end users, workstations, IP phones, wireless access points, and servers; and next-generation network routing products that interconnect public and private wireline and mobile networks for mobile, data, voice, and video applications.

Institutional Ownership by Quarter for Cisco Systems (NASDAQ:CSCO)

Sunday, May 27, 2018

Head-To-Head Comparison: Trinseo (TSE) vs. Rogers (ROG)

Trinseo (NYSE: TSE) and Rogers (NYSE:ROG) are both mid-cap basic materials companies, but which is the better investment? We will compare the two companies based on the strength of their institutional ownership, analyst recommendations, risk, profitability, earnings, valuation and dividends.

Institutional and Insider Ownership

Get Trinseo alerts:

97.0% of Trinseo shares are held by institutional investors. Comparatively, 93.8% of Rogers shares are held by institutional investors. 0.3% of Trinseo shares are held by insiders. Comparatively, 1.5% of Rogers shares are held by insiders. Strong institutional ownership is an indication that endowments, large money managers and hedge funds believe a company will outperform the market over the long term.

Volatility and Risk

Trinseo has a beta of 2.3, indicating that its share price is 130% more volatile than the S&P 500. Comparatively, Rogers has a beta of 1.51, indicating that its share price is 51% more volatile than the S&P 500.

Valuation and Earnings

This table compares Trinseo and Rogers’ revenue, earnings per share (EPS) and valuation.

Gross Revenue Price/Sales Ratio Net Income Earnings Per Share Price/Earnings Ratio
Trinseo $4.45 billion 0.73 $328.30 million $8.13 9.25
Rogers $821.04 million 2.65 $80.45 million $5.76 20.55

Trinseo has higher revenue and earnings than Rogers. Trinseo is trading at a lower price-to-earnings ratio than Rogers, indicating that it is currently the more affordable of the two stocks.

Dividends

Trinseo pays an annual dividend of $1.44 per share and has a dividend yield of 1.9%. Rogers does not pay a dividend. Trinseo pays out 17.7% of its earnings in the form of a dividend.

Analyst Ratings

This is a summary of recent ratings and recommmendations for Trinseo and Rogers, as reported by MarketBeat.

Sell Ratings Hold Ratings Buy Ratings Strong Buy Ratings Rating Score
Trinseo 0 2 4 0 2.67
Rogers 0 0 3 0 3.00

Trinseo presently has a consensus price target of $88.60, indicating a potential upside of 17.82%. Rogers has a consensus price target of $151.67, indicating a potential upside of 28.15%. Given Rogers’ stronger consensus rating and higher possible upside, analysts plainly believe Rogers is more favorable than Trinseo.

Profitability

This table compares Trinseo and Rogers’ net margins, return on equity and return on assets.

Net Margins Return on Equity Return on Assets
Trinseo 7.42% 59.08% 13.86%
Rogers 9.56% 13.71% 9.34%

Summary

Trinseo beats Rogers on 9 of the 16 factors compared between the two stocks.

Trinseo Company Profile

Trinseo S.A., a materials company, manufactures and markets synthetic rubber, latex binders, and plastic products in Europe, the United States, the Asia Pacific, and internationally. The company operates through Latex Binders, Synthetic Rubber, Performance Plastics, Basic Plastics, Feedstocks, and Americas Styrenics segments. The Latex Binders segment offers styrene-butadiene, styrene-acrylate, vinylidene chloride, and butadiene-methacrylate latex products for the commercial and niche carpet markets, as well as performance latex products for the adhesive, building and construction, and technical textile paper markets. The Synthetic Rubber segment provides styrene-butadiene rubber, emulsion styrene-butadiene rubber, nickel polybutadiene rubber, and neodymium polybutadiene rubber for use in tires, modifiers, and technical rubber products. The Performance Plastics segment offers engineered compounds and blend products for the automotive, consumer electronics, medical, electrical, and lighting markets. The Basic Plastics segment provides polystyrene, polycarbonate, acrylonitrile-butadiene-styrene, and styrene-acrylonitrile for use in appliances, food packaging and food service disposables, consumer electronics, and building and construction materials. The Feedstocks segment offers styrene monomer, a basic building block of plastics. The Americas Styrenics segment provides styrene and polystyrene, as well as general purpose polystyrenes, high heat, high impact resin, and STYRON A-TECH polystyrene products. The company's products are also used in carpet and artificial turf backing, coated and specialty paper, and other markets. Trinseo S.A. was founded in 2010 and is headquartered in Berwyn, Pennsylvania.
Rogers Company Profile

Rogers Corporation designs, develops, manufactures, and sells engineered materials and components worldwide. The company's Advanced Connectivity Solutions segment offers circuit materials and solutions for connectivity applications in wireless communications infrastructure, automotive, connected devices, wired infrastructure, consumer electronics, and aerospace/defense. Its Elastomeric Material Solutions segment provides elastomeric material solutions for critical cushioning, sealing, impact protection, and vibration management applications, including general industrial, portable electronics, consumer goods, automotive, mass transportation, construction, and printing applications. The company's Power Electronics Solutions segment offers ceramic substrate materials for power module applications, laminated bus bars for power inverter and high power interconnect applications, and micro-channel coolers. Its Other segment provides elastomeric components for applications in ground transportation, office equipment, consumer, and other markets; elastomer floats for level sensing in fuel tanks, motors, and storage tanks; and inverters for portable communications and automotive markets. The company also manufactures and sells polytetrafluoroethylene, ultra-high molecular weight polyethylene films, pressure sensitive tapes, and specialty products for the industrial, aerospace, automotive, and electronics markets. Rogers Corporation was founded in 1832 and is headquartered in Chandler, Arizona.

Saturday, May 26, 2018

Are AT&T Shares Worth The Risk?

If there's any company struggling more with recent bad publicity than Tesla (Nasdaq: TSLA), that company would have to be AT&T (NYSE: T). The company just can't seem to get out of its own way.

Take the ongoing merger with Time Warner (Nasdaq: TWX). AT&T management believes the deal will reinforce the Direct TV purchase, which cost AT&T $67 billion. But the $85 billion price tag for TWX, including an additional $50 billion of debt, seems a bridge too far. On top of that, the company is facing stiff resistance from the Department of Justice's Antitrust Division.

Now, it's no surprise that the deal would face regulatory resistance. What is a surprise is why a large-cap company with the vast resources of AT&T would hire a law firm with no actual experience in handling antitrust law. Instead, they hired Daniel Petrocelli, a defense attorney best known for winning a wrongful death suit against O.J. Simpson.

And while it's possible Petrocelli could win, it's definitely an uphill battle for an inexperienced team to go against a DOJ team with antitrust experience spanning several decades.

Then there's the revelation that AT&T paid $600,000 to Trump lawyer Michael Cohen. Ostensibly, the payment was for "insights" into the administration of Donald Trump -- whatever that means. But while the payment raises questions about the actions of AT&T management, the payment doesn't appear to be illegal, and therefore, will cause no lasting harm to the company. It's just another PR disaster for a company moving aimlessly.

A Real Threat
The biggest threat to AT&T is the growing trend of cord-cutting losses at Direct TV. While the 2015 deal looked good on paper, the deal closed about the same time as the cord-cutting trend first gained traction nationwide. Sadly, it appears AT&T management didn't see the secular trend coming.

Since then, AT&T has seen its Direct TV subscriber base decrease. Now, it's true that some of these losses have been partially offset by gains in the company's newest streaming version of Direct TV called DirectTV NOW. But the revenue differences between the two services are significant, meaning top line entertainment revenues are likely to continue shrinking for another few years.� �

AT&T Remains An Attractive Buy
Despite the mostly self-inflicted headwinds, AT&T makes for a compelling buy.

As you can see from the chart above, the stock is at the lower end of a channel dating back to 2012. At this level, support is strong, meaning a break below $30 is unlikely.

The stock trades at a price-earnings (P/E) ratio of 6.6 -- the lowest level in a decade. Of course, the stock's recent malaise is directly attributable to management's mishandling of the Time Warner and Direct TV deals.

Still, AT&T makes for an attractive investment. Sure, it might be a better investment if the Time Warner were to be nixed by the judge deciding the case next month. That's because pay TV is shrinking, and very little of the Time Warner deal will do anything to change that. At best, the deal provides the company a hedge of sorts against subscriber losses with the newfound ability to charge its competitors for programming. �

Don't Forget 5G
But AT&T's entertainment division isn't the only profit center for the company. AT&T and rival Verizon (NYSE: VZ) are leading the way for significant 5G rollouts in late 2018 and 2019. This is a big deal.

You see, networks using 5G technology are capable of delivering speed up to 10 times faster than 4G speeds. So a full HD movie taking about an hour to download on a 4G network will take just seconds on a 5G network. What this means is that the long-awaited promises of virtual reality, autonomous cars, and IoT (Internet of Things) will soon become a reality.

And A 6% Dividend

Any discussion of AT&T must eventually get around to the company's 6% dividend. But to be fair, we have to look at the dividend in light of the Time Warner deal. You see, should the deal be approved, the question becomes an issue of dividend sustainability in light of the amount of debt service the company takes on to fund the deal.

Given the vast size of TWX's TV and movie content, AT&T will have a trove of valuable content to sell through its various streaming services. Offsetting some of this revenue will be interest payments to finance the $50 billion needed to buy Time Warner. At current rates, the deal will require about $2 billion annually in interest payments.

On the other hand, TWX will generate $4.2 billion free cash flow this year. Adding this to AT&T's $18.3 billion in free cash flow, the combined company will have more than enough available cash to continue growing its $3 billion dividend.

And should the judge nix the TWX deal, AT&T's payout ratio of 42% ensures continued growth of the dividend through its regular operations.

At the end of the day, AT&T management has made some poor decisions in recent years. But the company is on solid footing -- making the 6% dividend attractive for investors looking for income.

Risks To Consider: The Time Warner decision from Federal Judge Richard Leon is expected no later than June 12, 2018. Whether the judges decides for or against the deal, expect increased volatility for AT&T shares. But regardless of the decision, the investment thesis surrounding the stock is bullish.

Action To Take:� Buy shares up to $34/share. Mitigate your risk by applying no more than 3% of your portfolio into shares of T. This recommendation is for investors with a medium to long-term time horizon, so expect to hold shares for five years or longer. Use a 25% trailing stop on your position.

Editor's Note: Put an extra $23,000 in your pocket every year...
There's a simple investing system that regular investors are using to collect extra paychecks every month... totaling as much as $23,000 per year. It's called The Dividend Trifecta, and they are telling us that this $23,000 number is the real thing. They don't have special resources or connections... they just have The Dividend Trifecta... and 10 spare minutes a month to use it. Now it's your turn: click here to learn how it works.

Thursday, May 24, 2018

Brokerages Anticipate Comtech Telecommunications Corp. (CMTL) Will Post Quarterly Sales of $144.40 M

Analysts expect that Comtech Telecommunications Corp. (NASDAQ:CMTL) will report $144.40 million in sales for the current fiscal quarter, Zacks Investment Research reports. Three analysts have provided estimates for Comtech Telecommunications’ earnings. The lowest sales estimate is $141.60 million and the highest is $146.60 million. Comtech Telecommunications reported sales of $127.79 million during the same quarter last year, which indicates a positive year over year growth rate of 13%. The company is expected to issue its next quarterly earnings report on Wednesday, June 6th.

On average, analysts expect that Comtech Telecommunications will report full-year sales of $575.40 million for the current fiscal year, with estimates ranging from $570.40 million to $580.50 million. For the next year, analysts anticipate that the company will report sales of $602.80 million per share, with estimates ranging from $599.00 million to $609.40 million. Zacks’ sales calculations are an average based on a survey of research firms that that provide coverage for Comtech Telecommunications.

Get Comtech Telecommunications alerts:

Comtech Telecommunications (NASDAQ:CMTL) last released its quarterly earnings results on Wednesday, March 7th. The communications equipment provider reported $0.07 EPS for the quarter, topping the consensus estimate of ($0.08) by $0.15. Comtech Telecommunications had a return on equity of 2.20% and a net margin of 4.87%. The company had revenue of $133.70 million for the quarter, compared to analyst estimates of $124.65 million. During the same quarter in the previous year, the company posted $0.01 earnings per share. The firm’s revenue was down 3.8% compared to the same quarter last year.

A number of research firms have commented on CMTL. Citigroup started coverage on Comtech Telecommunications in a research report on Thursday, May 17th. They set a “neutral” rating and a $33.00 target price on the stock. BidaskClub lowered Comtech Telecommunications from a “hold” rating to a “sell” rating in a research note on Thursday, January 25th. Zacks Investment Research lowered Comtech Telecommunications from a “buy” rating to a “hold” rating in a research note on Thursday, February 8th. BMO Capital Markets upped their target price on Comtech Telecommunications to $35.00 and gave the company an “outperform” rating in a research note on Friday, March 9th. Finally, Jefferies Group reiterated a “hold” rating on shares of Comtech Telecommunications in a research note on Thursday, March 15th. Five investment analysts have rated the stock with a hold rating, two have issued a buy rating and one has issued a strong buy rating to the company’s stock. Comtech Telecommunications presently has an average rating of “Buy” and a consensus price target of $28.10.

In other Comtech Telecommunications news, insider Richard L. Burt sold 82,700 shares of the company’s stock in a transaction dated Monday, March 12th. The stock was sold at an average price of $30.46, for a total transaction of $2,519,042.00. Following the completion of the sale, the insider now directly owns 178,315 shares in the company, valued at $5,431,474.90. The sale was disclosed in a legal filing with the Securities & Exchange Commission, which is accessible through this hyperlink. Also, Director Edwin Kantor sold 3,318 shares of the company’s stock in a transaction dated Tuesday, April 3rd. The stock was sold at an average price of $30.49, for a total value of $101,165.82. Following the sale, the director now owns 4,057 shares of the company’s stock, valued at $123,697.93. The disclosure for this sale can be found here. Insiders have sold 116,018 shares of company stock valued at $3,590,708 over the last 90 days. 7.00% of the stock is currently owned by insiders.

Large investors have recently made changes to their positions in the business. BlackRock Inc. boosted its position in shares of Comtech Telecommunications by 1.7% in the first quarter. BlackRock Inc. now owns 3,195,955 shares of the communications equipment provider’s stock worth $95,528,000 after buying an additional 54,591 shares during the period. Schwab Charles Investment Management Inc. boosted its position in shares of Comtech Telecommunications by 3.3% in the fourth quarter. Schwab Charles Investment Management Inc. now owns 410,628 shares of the communications equipment provider’s stock worth $9,084,000 after buying an additional 13,261 shares during the period. State of Wisconsin Investment Board boosted its position in shares of Comtech Telecommunications by 0.6% in the first quarter. State of Wisconsin Investment Board now owns 320,000 shares of the communications equipment provider’s stock worth $9,565,000 after buying an additional 2,000 shares during the period. Pacific Ridge Capital Partners LLC boosted its position in shares of Comtech Telecommunications by 3.1% in the fourth quarter. Pacific Ridge Capital Partners LLC now owns 302,183 shares of the communications equipment provider’s stock worth $6,684,000 after buying an additional 9,080 shares during the period. Finally, Goldman Sachs Group Inc. boosted its position in shares of Comtech Telecommunications by 62.1% in the fourth quarter. Goldman Sachs Group Inc. now owns 279,610 shares of the communications equipment provider’s stock worth $6,185,000 after buying an additional 107,108 shares during the period. Institutional investors own 88.29% of the company’s stock.

Shares of Comtech Telecommunications traded up $0.28, reaching $31.09, during trading on Friday, Marketbeat reports. The company’s stock had a trading volume of 49,471 shares, compared to its average volume of 174,821. The company has a debt-to-equity ratio of 0.36, a current ratio of 1.82 and a quick ratio of 1.29. The company has a market cap of $736.00 million, a PE ratio of 91.44, a price-to-earnings-growth ratio of 11.43 and a beta of 1.49. Comtech Telecommunications has a 12-month low of $13.95 and a 12-month high of $32.94.

The company also recently declared a quarterly dividend, which was paid on Friday, May 18th. Shareholders of record on Wednesday, April 18th were paid a dividend of $0.10 per share. The ex-dividend date of this dividend was Tuesday, April 17th. This represents a $0.40 annualized dividend and a yield of 1.29%. Comtech Telecommunications’s dividend payout ratio is presently 117.65%.

About Comtech Telecommunications

Comtech Telecommunications Corp. designs, develops, produces, and markets products, systems, and services for communications solutions. The company's Commercial Solutions segment provides ground-based equipment, such as single channel per carrier modems and solid state amplifiers that facilitate the transmission of voice, video, and data, as well as offers traveling wave tube amplifiers comprising high power narrow-band amplifiers that are used to amplify signals from satellite earth stations; and safety and security technology solutions that enable 911 c.

Get a free copy of the Zacks research report on Comtech Telecommunications (CMTL)

For more information about research offerings from Zacks Investment Research, visit Zacks.com